Colorization
Enumeration of available color maps. |
|
Registers a customized color map. |
|
Colorizes a label image. |
|
Colorizes 2D data array using a colormap. |
|
Returns corresponding color map colors for a list of scalar values. |
|
Utility class for scaled colorization of a data stream. |
|
Enumeration of how the colorization limits should be computed. |
|
Multiplicative relief shading. |
|
Computes the peaks example data. |
Color Maps
Refer to the color map tutorial for additional notes, exemplary code and visualizations of all available color maps.
- class viren2d.ColorMap
Enumeration of available color maps.
All available color maps can be listed via
list_all().- Explicit instantiation:
>>> cmap = viren2d.ColorMap.Gouldian
- Implicit conversion:
>>> viren2d.colorize_scaled(data=data, colormap='gouldian')
Corresponding C++ API:
viren2d::ColorMap.Members:
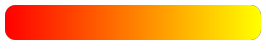
- Autumn :
Sequential red-to-yellow color map. This color map is not perceptually uniform. Based on matplotlib’s autumn map.
- Example:
>>> import numpy as np
>>> import viren2d
>>> data = np.vstack(25 * (np.arange(0, 256),))
>>> vis = viren2d.colorize_scaled(
>>>     data, colormap='autumn', low=0, high=255,
>>>     bins=256, output_channels=3)
- BlackBody :
Black-red-yellow-white, perceptually uniform sequential color map inspired by black-body radiation. This color map definition has been taken from Kenneth Moreland’s website.
- Example:
>>> import numpy as np
>>> import viren2d
>>> data = np.vstack(25 * (np.arange(0, 256),))
>>> vis = viren2d.colorize_scaled(
>>>     data, colormap='black-body', low=0, high=255,
>>>     bins=256, output_channels=3)
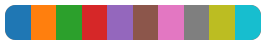
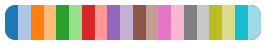
- Categories10 :
Color map with 10 distinct colors, suitable for categorical data. Based on matplotlib’s tab10 map.
- Example:
>>> import numpy as np
>>> import viren2d
>>> data = np.random.randint(0, 20000, (10, 20))
>>> vis = viren2d.colorize_labels(
>>>     data, colormap='categories-10', output_channels=3)
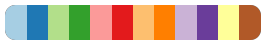
- Categories12 :
Color map with 12 distinct colors, suitable for categorical data. Based on ColorBrewer2’s 12-class paired map.
- Example:
>>> import numpy as np
>>> import viren2d
>>> data = np.random.randint(0, 20000, (10, 20))
>>> vis = viren2d.colorize_labels(
>>>     data, colormap='categories-12', output_channels=3)
- Categories20 :
Color map with 20 distinct colors, suitable for categorical data. Based on matplotlib’s tab20 map.
- Example:
>>> import numpy as np
>>> import viren2d
>>> data = np.random.randint(0, 20000, (10, 20))
>>> vis = viren2d.colorize_labels(
>>>     data, colormap='categories-20', output_channels=3)
- Cividis :
Perceptually uniform sequential color map suitable for viewers with color vision deficiency (CVD). Published by Nuñez, Anderton and Renslow.
- Example:
>>> import numpy as np
>>> import viren2d
>>> data = np.vstack(25 * (np.arange(0, 256),))
>>> vis = viren2d.colorize_scaled(
>>>     data, colormap='cividis', low=0, high=255,
>>>     bins=256, output_channels=3)
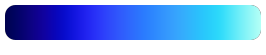
- Cold :
Blue shades from dark to light. This is the CET-L06 color map by Peter Kovesi, who released under the CC-BY 4.0 license.
- Example:
>>> import numpy as np
>>> import viren2d
>>> data = np.vstack(25 * (np.arange(0, 256),))
>>> vis = viren2d.colorize_scaled(
>>>     data, colormap='cold', low=0, high=255,
>>>     bins=256, output_channels=3)
- ColorBlindDiverging :
Perceptually uniform diverging color map for protanopic/deuteranopic viewers. This is the CET-CBD1 color map by Peter Kovesi, who released under the CC-BY 4.0 license.
- Example:
>>> import numpy as np
>>> import viren2d
>>> data = np.vstack(25 * (np.arange(0, 256),))
>>> vis = viren2d.colorize_scaled(
>>>     data, colormap='cvd-diverging', low=0, high=255,
>>>     bins=256, output_channels=3)
- ColorBlindSequential :
Perceptually uniform sequential color map for protanopic/deuteranopic viewers. This is the CET-CBL1 color map by Peter Kovesi, who released under the CC-BY 4.0 license.
- Example:
>>> import numpy as np
>>> import viren2d
>>> data = np.vstack(25 * (np.arange(0, 256),))
>>> vis = viren2d.colorize_scaled(
>>>     data, colormap='cvd-sequential', low=0, high=255,
>>>     bins=256, output_channels=3)
- ColorBlindSequentialVivid :
Perceptually uniform sequential color map with maximal chroma, suitable for Protanopic/Deuteranopic viewers. This is the CET-CBL2 color map by Peter Kovesi, who released under the CC-BY 4.0 license.
- Example:
>>> import numpy as np
>>> import viren2d
>>> data = np.vstack(25 * (np.arange(0, 256),))
>>> vis = viren2d.colorize_scaled(
>>>     data, colormap='cvd-sequential-vivid', low=0, high=255,
>>>     bins=256, output_channels=3)
- ColorBlindOrientation :
Cyclic blue-white-yellow-black color map for four orientations/phase angles, suitable for Protanopic/Deuteranopic viewers. This is the CET-CBC1 color map by Peter Kovesi, who released under the CC-BY 4.0 license.
- Example:
>>> import viren2d
>>> vis = viren2d.optical_flow_legend(size=200,
>>>     colormap='cvd-orientation', output_channels=4, clip_circle=True)
- Copper :
Sequential color map from black to light copper. This color map has kinks in the lightness curve, which can lead to a perceived banding of the data in those value ranges. Based on matplotlib’s copper map.
- Example:
>>> import numpy as np
>>> import viren2d
>>> data = np.vstack(25 * (np.arange(0, 256),))
>>> vis = viren2d.colorize_scaled(
>>>     data, colormap='copper', low=0, high=255,
>>>     bins=256, output_channels=3)
- Custom1 :
Placeholder to support using your own color map, see
set_custom_colormap().- Example:
>>> import numpy as np
>>> import viren2d
>>> data = np.vstack(25 * (np.arange(0, 256),))
>>> viren2d.set_custom_colormap(
>>>     'custom1',
>>>     ['navy-blue', 'azure', 'blue', 'light-blue'])
>>> vis = viren2d.colorize_scaled(
>>>     data, colormap='custom1', low=0, high=255,
>>>     bins=256, output_channels=3)
- Custom2 :
Placeholder to support using your own color map, see
set_custom_colormap().- Example:
>>> import numpy as np
>>> import viren2d
>>> data = np.vstack(25 * (np.arange(0, 256),))
>>> viren2d.set_custom_colormap(
>>>     'custom2',
>>>     ['navy-blue', 'azure', 'blue', 'light-blue'])
>>> vis = viren2d.colorize_scaled(
>>>     data, colormap='custom2', low=0, high=255,
>>>     bins=256, output_channels=3)
- Custom3 :
Placeholder to support using your own color map, see
set_custom_colormap().- Example:
>>> import numpy as np
>>> import viren2d
>>> data = np.vstack(25 * (np.arange(0, 256),))
>>> viren2d.set_custom_colormap(
>>>     'custom3',
>>>     ['navy-blue', 'azure', 'blue', 'light-blue'])
>>> vis = viren2d.colorize_scaled(
>>>     data, colormap='custom3', low=0, high=255,
>>>     bins=256, output_channels=3)
- Disparity :
High contrast color map for depth & disparity images. Based on disparity for MATLAB by Oliver Woodford, who released it under the BSD 3-Clause license.
- Example:
>>> import numpy as np
>>> import viren2d
>>> data = np.vstack(25 * (np.arange(0, 256),))
>>> vis = viren2d.colorize_scaled(
>>>     data, colormap='disparity', low=0, high=255,
>>>     bins=256, output_channels=3)
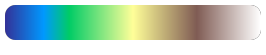
- Earth :
A blue-green-brown color map to visualize topography data. Based on matplotlib’s gist_earth map.
- Example:
>>> import numpy as np
>>> import viren2d
>>> data = np.vstack(25 * (np.arange(0, 256),))
>>> vis = viren2d.colorize_scaled(
>>>     data, colormap='earth', low=0, high=255,
>>>     bins=256, output_channels=3)
- GlasbeyDark :
Color map for categorical data, best suited for light backgrounds, i.e. light colors are omitted. This color map is adapted from the colorcet Python package and was initially created using Glasbey’s method.
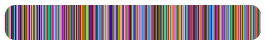
- Example:
>>> import numpy as np
>>> import viren2d
>>> data = np.random.randint(0, 20000, (10, 20))
>>> vis = viren2d.colorize_labels(
>>>     data, colormap='glasbey-dark', output_channels=3)
- GlasbeyLight :
Color map for categorical data, best suited for dark backgrounds, i.e. dark colors are omitted. This color map is adapted from the colorcet Python package and was initially created using Glasbey’s method.
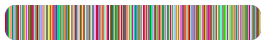
- Example:
>>> import numpy as np
>>> import viren2d
>>> data = np.random.randint(0, 20000, (10, 20))
>>> vis = viren2d.colorize_labels(
>>>     data, colormap='glasbey-light', output_channels=3)
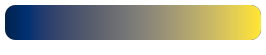
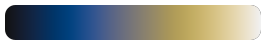
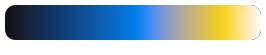
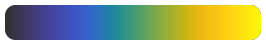
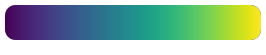
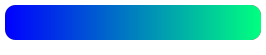
- Gouldian :
Black-blue-green-orange-yellow perceptually uniform sequential color map. Similar to MATLAB’s parula, but with a smoother path and more uniform slope upwards in CIELAB space. This is the CET-L20 color map by Peter Kovesi, who released under the CC-BY 4.0 license.
- Example:
>>> import numpy as np
>>> import viren2d
>>> data = np.vstack(25 * (np.arange(0, 256),))
>>> vis = viren2d.colorize_scaled(
>>>     data, colormap='gouldian', low=0, high=255,
>>>     bins=256, output_channels=3)
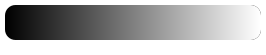
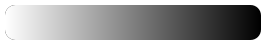
- Gray :
Standard grayscale range from black-to-white, a.k.a. white-hot.
- Example:
>>> import numpy as np
>>> import viren2d
>>> data = np.vstack(25 * (np.arange(0, 256),))
>>> vis = viren2d.colorize_scaled(
>>>     data, colormap='gray', low=0, high=255,
>>>     bins=256, output_channels=3)
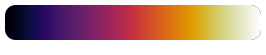
- Hell :
Black-purple-red-yellow-white, perceptually uniform sequential color map. Similar to Inferno but starts from black and ends white. Based on hell from Agama.
- Example:
>>> import numpy as np
>>> import viren2d
>>> data = np.vstack(25 * (np.arange(0, 256),))
>>> vis = viren2d.colorize_scaled(
>>>     data, colormap='hell', low=0, high=255,
>>>     bins=256, output_channels=3)
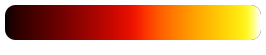
- Hot :
Black-red-yellow-white perceptually uniform sequential color map. This is the CET-L03 color map by Peter Kovesi, who released under the CC-BY 4.0 license.
- Example:
>>> import numpy as np
>>> import viren2d
>>> data = np.vstack(25 * (np.arange(0, 256),))
>>> vis = viren2d.colorize_scaled(
>>>     data, colormap='hot', low=0, high=255,
>>>     bins=256, output_channels=3)
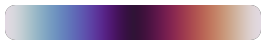
- HSV :
Cyclic color map obtained by varying the hue. Cycles through red-yellow-green-cyan-blue-magenta-red.
- Example:
>>> import viren2d
>>> vis = viren2d.optical_flow_legend(size=200,
>>>     colormap='hsv', output_channels=4, clip_circle=True)
- Inferno :
Bluish-to-reddish, perceptually uniform sequential color map with monotonically increasing luminance. Proposed by Stéfan van der Walt and Nathaniel Smith and integrated into matplotlib >= 1.15.
- Example:
>>> import numpy as np
>>> import viren2d
>>> data = np.vstack(25 * (np.arange(0, 256),))
>>> vis = viren2d.colorize_scaled(
>>>     data, colormap='inferno', low=0, high=255,
>>>     bins=256, output_channels=3)
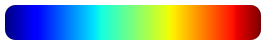
- Jet :
The classic rainbow color map, based on MATLAB’s jet map.
Note that this color map has several known limitations (e.g. reversed lightness gradients at yellow and red affect the viewer’s perceptual ordering). Refer to the excellent article by Peter Kovesi for more details about these issues.
- Example:
>>> import numpy as np
>>> import viren2d
>>> data = np.vstack(25 * (np.arange(0, 256),))
>>> vis = viren2d.colorize_scaled(
>>>     data, colormap='jet', low=0, high=255,
>>>     bins=256, output_channels=3)
- Ocean :
A green-blue color map to visualize water depths. Based on matplotlib’s ocean map.
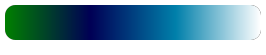
- Example:
>>> import numpy as np
>>> import viren2d
>>> data = np.vstack(25 * (np.arange(0, 256),))
>>> vis = viren2d.colorize_scaled(
>>>     data, colormap='ocean', low=0, high=255,
>>>     bins=256, output_channels=3)
- OpticalFlow :
Cyclic HSV-like color map with reduced colors. Suitable to visualize optical flow fields. Based on the color map used by the Middlebury Optical Flow benchmark.
- Example:
>>> import viren2d
>>> vis = viren2d.optical_flow_legend(size=200,
>>>     colormap='optical-flow', output_channels=4, clip_circle=True)
- Orientation4 :
Cyclic magenta-yellow-green-blue color map for four orientations/phase angles to be visualized. This is the CET-C2 color map by Peter Kovesi, who released under the CC-BY 4.0 license.
- Example:
>>> import viren2d
>>> vis = viren2d.optical_flow_legend(size=200,
>>>     colormap='orientation4', output_channels=4, clip_circle=True)
- Orientation6 :
Six-color cyclic map with primaries and secondaries matched in lightness. This is the CET-C6 color map by Peter Kovesi, who released under the CC-BY 4.0 license.
- Example:
>>> import viren2d
>>> vis = viren2d.optical_flow_legend(size=200,
>>>     colormap='orientation6', output_channels=4, clip_circle=True)
- Rainbow :
The “least worse” rainbow color map, i.e. CET-R2, by Peter Kovesi, who released under the CC-BY 4.0 license.
- Example:
>>> import numpy as np
>>> import viren2d
>>> data = np.vstack(25 * (np.arange(0, 256),))
>>> vis = viren2d.colorize_scaled(
>>>     data, colormap='rainbow', low=0, high=255,
>>>     bins=256, output_channels=3)
- Relief :
Green-brownish-bluish perceptually uniform sequential color map for relief shading. This is the CET-L11 color map by Peter Kovesi, who released under the CC-BY 4.0 license.
- Example:
>>> import numpy as np
>>> import viren2d
>>> data = np.vstack(25 * (np.arange(0, 256),))
>>> vis = viren2d.colorize_scaled(
>>>     data, colormap='relief', low=0, high=255,
>>>     bins=256, output_channels=3)
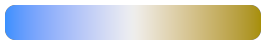
- ReliefLowContrast :
Low contrast (isoluminant), blue-green-orange perceptually uniform sequential color map for relief shading. This is the CET-I2 color map by Peter Kovesi, who released under the CC-BY 4.0 license.
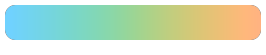
- Example:
>>> import numpy as np
>>> import viren2d
>>> data = np.vstack(25 * (np.arange(0, 256),))
>>> vis = viren2d.colorize_scaled(
>>>     data, colormap='relief-low-contrast', low=0, high=255,
>>>     bins=256, output_channels=3)
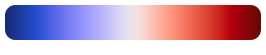
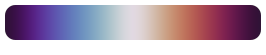
- Seismic :
Diverging blue-white-red map with vivid colors. Based on matplotlib’s seismic map.
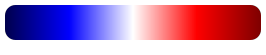
- Example:
>>> import numpy as np
>>> import viren2d
>>> data = np.vstack(25 * (np.arange(0, 256),))
>>> vis = viren2d.colorize_scaled(
>>>     data, colormap='seismic', low=0, high=255,
>>>     bins=256, output_channels=3)
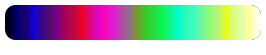
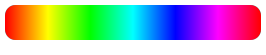
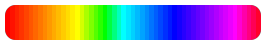
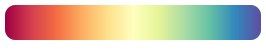
- Spectral :
Color map covering the spectral colors from ultra-violett to infrared. Based on matplotlib’s NIPY Spectral map.
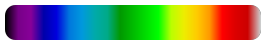
- Example:
>>> import numpy as np
>>> import viren2d
>>> data = np.vstack(25 * (np.arange(0, 256),))
>>> vis = viren2d.colorize_scaled(
>>>     data, colormap='spectral', low=0, high=255,
>>>     bins=256, output_channels=3)
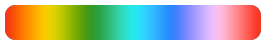
- SpectralDiverging :
Diverging redish-yellow-bluish map. Based on matplotlib’s Spectral map.
- Example:
>>> import numpy as np
>>> import viren2d
>>> data = np.vstack(25 * (np.arange(0, 256),))
>>> vis = viren2d.colorize_scaled(
>>>     data, colormap='spectral-diverging', low=0, high=255,
>>>     bins=256, output_channels=3)
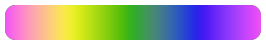
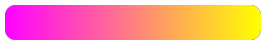
- Spring :
Sequential pink-to-yellow color map. This color map is not perceptually uniform. Based on matplotlib’s spring map.
- Example:
>>> import numpy as np
>>> import viren2d
>>> data = np.vstack(25 * (np.arange(0, 256),))
>>> vis = viren2d.colorize_scaled(
>>>     data, colormap='spring', low=0, high=255,
>>>     bins=256, output_channels=3)
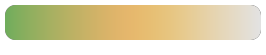
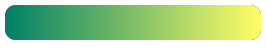
- Summer :
Sequential green-to-yellow color map. This color map is not perceptually uniform. Based on matplotlib’s summer map.
- Example:
>>> import numpy as np
>>> import viren2d
>>> data = np.vstack(25 * (np.arange(0, 256),))
>>> vis = viren2d.colorize_scaled(
>>>     data, colormap='summer', low=0, high=255,
>>>     bins=256, output_channels=3)
- Temperature :
Diverging blue-white-red color map. This is the CET-D01A color map by Peter Kovesi, who released under the CC-BY 4.0 license.
- Example:
>>> import numpy as np
>>> import viren2d
>>> data = np.vstack(25 * (np.arange(0, 256),))
>>> vis = viren2d.colorize_scaled(
>>>     data, colormap='temperature', low=0, high=255,
>>>     bins=256, output_channels=3)
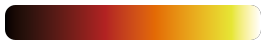
- TemperatureDark :
Diverging blue-black-red color map. This is the CET-D04 color map by Peter Kovesi, who released under the CC-BY 4.0 license.
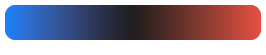
- Example:
>>> import numpy as np
>>> import viren2d
>>> data = np.vstack(25 * (np.arange(0, 256),))
>>> vis = viren2d.colorize_scaled(
>>>     data, colormap='temperature-dark', low=0, high=255,
>>>     bins=256, output_channels=3)
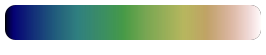
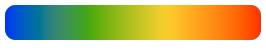
- Terrain :
A blue-green-yellowish-brownish color map to visualize topography data. Based on matplotlib’s terrain map.
- Example:
>>> import numpy as np
>>> import viren2d
>>> data = np.vstack(25 * (np.arange(0, 256),))
>>> vis = viren2d.colorize_scaled(
>>>     data, colormap='terrain', low=0, high=255,
>>>     bins=256, output_channels=3)
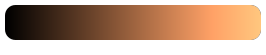
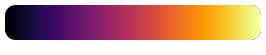
- Thermal :
Black-purple-red-yellow-white sequential color map for thermographic images, also known as iron or ironbow.
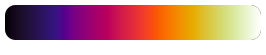
- Example:
>>> import numpy as np
>>> import viren2d
>>> data = np.vstack(25 * (np.arange(0, 256),))
>>> vis = viren2d.colorize_scaled(
>>>     data, colormap='thermal', low=0, high=255,
>>>     bins=256, output_channels=3)
- Turbo :
A rainbow color map similar to the well-known MATLAB jet, but following a smoother path through the CIELAB color space. Published by Google (Anton Mikhailov) under the Apache-2.0 license. Turbo is often used for depth and disparity values.
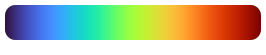
- Example:
>>> import numpy as np
>>> import viren2d
>>> data = np.vstack(25 * (np.arange(0, 256),))
>>> vis = viren2d.colorize_scaled(
>>>     data, colormap='turbo', low=0, high=255,
>>>     bins=256, output_channels=3)
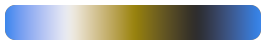
- Twilight :
Cyclic white-blue-black-red-white map with perceptually uniform lightness and color contrast over the whole range. Based on matplotlib’s twilight map.
- Example:
>>> import viren2d
>>> vis = viren2d.optical_flow_legend(size=200,
>>>     colormap='twilight', output_channels=4, clip_circle=True)
- TwilightShifted :
Cyclic black-blue-white-red-black map with perceptually uniform lightness and color contrast over the whole range. Based on matplotlib’s twilight_shifted map.
- Example:
>>> import viren2d
>>> vis = viren2d.optical_flow_legend(size=200,
>>>     colormap='twilight-shifted', output_channels=4, clip_circle=True)
- Viridis :
Perceptually uniform sequential color map. Proposed by Stéfan van der Walt and Nathaniel Smith, based on a design by Eric Firing, now the default color map of matplotlib.
- Example:
>>> import numpy as np
>>> import viren2d
>>> data = np.vstack(25 * (np.arange(0, 256),))
>>> vis = viren2d.colorize_scaled(
>>>     data, colormap='viridis', low=0, high=255,
>>>     bins=256, output_channels=3)
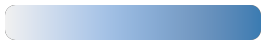
- Water :
Perceptually uniform sequential color map for water depth. This is the CET-L12 color map by Peter Kovesi, who released under the CC-BY 4.0 license.
- Example:
>>> import numpy as np
>>> import viren2d
>>> data = np.vstack(25 * (np.arange(0, 256),))
>>> vis = viren2d.colorize_scaled(
>>>     data, colormap='water', low=0, high=255,
>>>     bins=256, output_channels=3)
- Winter :
Sequential blue-to-light-green color map. This color map is not perceptually uniform. Based on matplotlib’s winter map.
- Yarg :
Inverted grayscale range from white-to-black, a.k.a. black-hot.
- Example:
>>> import numpy as np
>>> import viren2d
>>> data = np.vstack(25 * (np.arange(0, 256),))
>>> vis = viren2d.colorize_scaled(
>>>     data, colormap='yarg', low=0, high=255,
>>>     bins=256, output_channels=3)
- static list_all() List[viren2d.ColorMap]
Returns all predefined
ColorMapvalues.Convenience utility to easily iterate all enumeration values. This list will not include the customizable enumeration values.
Corresponding C++ API:
viren2d::ListColorMaps.
Custom Color Maps
Use set_custom_colormap() to register a custom color map.
Additionally, get_colormap() can be used to retrieve the colors
of a predefined map, which can then be adjusted to your application needs.
- viren2d.get_colormap(colormap: viren2d.ColorMap) List[viren2d.Color]
Returns the
listofColorfor the specified color map.Corresponding C++ API:
viren2d::GetColorMapColors.- Parameters:
colormap – The
ColorMapenumeration value or its string representation.
Example
>>> colors = viren2d.get_colormap('ocean')
- viren2d.set_custom_colormap(id: viren2d.ColorMap, colors: List[viren2d.Color]) None
Registers a customized color map.
Allows library users to register their own color maps for the enumeration values
ColorMap.Custom1,ColorMap.Custom2, andColorMap.Custom3.Corresponding C++ API:
viren2d::SetCustomColorMap.- Parameters:
Example
>>> import viren2d
>>> import numpy as np
>>> # Create a custom color map.
>>> # Example 1: Define colors manually.
>>> viren2d.set_custom_colormap(
>>>     'custom1', ['#800000', (0.94, 0.13, 0.15), 'rose-red'])
>>> # Example 2: Reverse an existing color map.
>>> cmap = viren2d.get_colormap('water')
>>> viren2d.set_custom_colormap('custom2', cmap[::-1])
>>> # Apply a custom color map, e.g. for label colorization:
>>> labels = np.array(
>>>     [[0, 1, 2], [-3, -4, -6], [20000, 20001, 20003]], dtype=np.int32)
>>> vis = viren2d.colorize_labels(labels=labels, colormap='custom1')
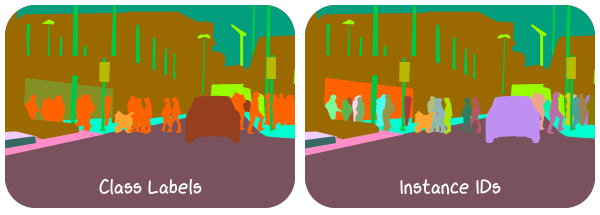
Label/Category Colorization
- viren2d.colorize_labels(labels: viren2d.ImageBuffer, colormap: viren2d.ColorMap = viren2d.ColorMap('glasbey-dark'), output_channels: int = 3) viren2d.ImageBuffer
Colorizes a label image.
Corresponding C++ API:
viren2d::ColorizeLabels.- Parameters:
labels – A single channel
ImageBufferornumpy.ndarrayholding the labels as integral data type.colormap – The
ColorMapto be used for colorization. In addition to the enumeration value, its string representation can be used for convenience.output_channels – Number of output channels as
int. Must be either 3 or 4. The optional 4th channel will be considered an alpha channel and set to 255.
- Returns:
A 3- or 4-channel
ImageBufferof typenumpy.uint8.
Example
>>> import viren2d
>>> import numpy as np
>>> labels = np.array(
>>>     [[1, 2, 3], [4, 5, 6], [20000, 20001, 20003]],
>>>     dtype=np.int32)
>>> vis = viren2d.colorize_labels(
>>>     labels, colormap='category-20', output_channels=3)
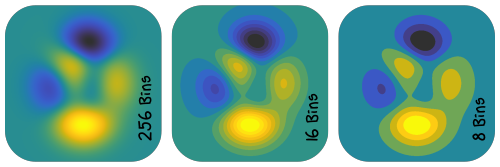
Scaled Colorization
- viren2d.colorize_scaled(data: viren2d.ImageBuffer, colormap: viren2d.ColorMap = viren2d.ColorMap('gouldian'), low: float = inf, high: float = inf, output_channels: int = 3, bins: int = 256) viren2d.ImageBuffer
Colorizes 2D data array using a colormap.
Corresponding C++ API:
viren2d::ColorizeScaled.- Parameters:
data – A single channel
ImageBufferornumpy.ndarrayholding the data for colorization.colormap – The
ColorMapto be used for colorization. In addition to the enumeration value, its string representation can be used for convenience.low – Lower limit of the input values as
float. If eitherloworhighareinfornan, both limits will be computed from the inputdata.high – Upper limit of the input values as
float.output_channels – Number of output channels as
int. Must be either 3 or 4. The optional 4th channel will be considered an alpha channel and set to 255.bins – Number of discretization bins as
int. Must be \(\geq 2\). This parameter will be ignored if the selected color map has less thanbinscolors.
- Returns:
A 3- or 4-channel
ImageBufferof typenumpy.uint8.
Example
>>> import viren2d
>>> data = viren2d.peaks(height=400, width=400)
>>> vis = viren2d.colorize_scaled(
>>>     data, colormap='gouldian', low=-8, high=8,
>>>     bins=256, output_channels=3)
- viren2d.colorize_scalars(values: List[float], colormap: viren2d.ColorMap = viren2d.ColorMap('gouldian'), low: float = inf, high: float = inf, bins: int = 256) List[viren2d.Color]
Returns corresponding color map colors for a list of scalar values.
Performs scaled colorization similar to
colorize_scaled(), but operates on a list of scalars (instead of anumpy.ndarray) and returns a list ofColorobjects.Corresponding C++ API:
viren2d::ColorizeScalars.- Parameters:
values – The input list of scalar values.
colormap – The
ColorMapto be used for colorization. In addition to the enumeration value, its string representation can be used for convenience.low – Lower limit of the input data as
float. If \(\infty\) or NaN, it will be computed from the input data.high – Upper limit of the input data as
float. If \(\infty\) or NaN, it will be computed from the input data.bins – Number of discretization bins as
int. Must be \(\geq 2\). This parameter will be ignored if the selected color map has less thanbinscolors.
- Returns:
Example
>>> import viren2d
>>> values = [10, -5, 3, 177, 12345]
>>> colors = viren2d.colorize_scalars(
>>>     values=values, colormap='seismic', low=float("inf"),
>>>     high=float("inf"), bins=256)
- class viren2d.StreamColorizer
Utility class for scaled colorization of a data stream.
This class takes care of computing/storing the input data limits, the selected color map, etc. This comes in handy whenever we need to apply the same colorization over and over again. For example, think of displaying the live stream of a time-of-flight sensor.
Corresponding C++ API:
viren2d::StreamColorizer.Example
>>> # Open depth camera stream
>>> depth_cam = ...
>>> # Configure stream colorization with fixed data limits
>>> colorizer = viren2d.StreamColorizer(
>>>     colormap='turbo', mode='fixed', bins=32,
>>>     output_channels=3, low=0, high=5000)
>>> # Colorize the incoming data stream
>>> while depth_cam.is_available():
>>>     depth = depth_cam.next()
>>>     vis = colorizer.colorize(depth)
>>>     # Or alternatively use the call operator:
>>>     vis = colorizer(depth)
Methods:
Alias of
colorize().Creates a customized stream colorizer.
Applies the configured scaled colorization.
Attributes:
Number of discretization bins.
The selected color map.
Lower limit of the input data.
Lower limit of the input data.
Specifies how the data limits should be computed.
Number of output channels.
- __call__(self: viren2d.StreamColorizer, data: viren2d.ImageBuffer) viren2d.ImageBuffer
Alias of
colorize().
- __init__(self: viren2d.StreamColorizer, colormap: viren2d.ColorMap, mode: object = 'continuous', bins: int = 256, output_channels: int = 3, low: float = inf, high: float = inf) None
Creates a customized stream colorizer.
- Parameters:
colormap – The
ColorMapto be used for colorization. In addition to the enumeration value, its string representation can be used for convenience.mode – The
LimitsModespecifying how the data limits should be computed. Can be provided as enumeration value or its corresponding string representation. If set toLimitsMode.Fixed, then the parameterslowandhighmust be set to valid numbers.bins – Number of discretization bins as
int. Must be \(\geq 2\). This parameter will be ignored if the selected color map has less thanbinscolors.output_channels – Number of output channels as
int. Must be either 3 or 4. The optional 4th channel will be considered an alpha channel and set to 255.low – Lower limit of the input data as
float. Will only be considered ifmodeisLimitsMode.Fixed.high – Upper limit of the input data as
float. Will only be considered ifmodeisLimitsMode.Fixed.
- property bins
Number of discretization bins.
Must be \(\geq 2\). This parameter will be ignored if the selected
colormaphas less thanbinscolors.Corresponding C++ API:
viren2d::StreamColorizer::GetBins/SetBins.- Type:
- colorize(self: viren2d.StreamColorizer, data: viren2d.ImageBuffer) viren2d.ImageBuffer
Applies the configured scaled colorization.
Corresponding C++ API:
viren2d::StreamColorizer::Colorize.- Parameters:
data – A single channel
ImageBufferornumpy.ndarrayholding the data for colorization.- Returns:
The colorization as
ImageBufferof typenumpy.uint8withoutput_channelschannels.
- property colormap
The selected color map.
In addition to the enumeration value, the corresponding string representation can be used to set this property.
Corresponding C++ API:
viren2d::StreamColorizer::GetColorMap/SetColorMap.- Type:
- property limit_high
Lower limit of the input data.
If you intend to set this to inf/nan, ensure that
limits_modeis not set tofixed, or aValueErrorwill be raised.Corresponding C++ API:
viren2d::StreamColorizer::GetLimitHigh/SetLimitHigh.- Type:
- property limit_low
Lower limit of the input data.
If you intend to set this to inf/nan, ensure that
limits_modeis not set tofixed, or aValueErrorwill be raised.Corresponding C++ API:
viren2d::StreamColorizer::GetLimitLow/SetLimitLow.- Type:
- property limits_mode
Specifies how the data limits should be computed. Can be set via the enumeration value or its corresponding string representation.
Note that
limit_lowandlimit_highmust be set to valid numbers before the mode is changed tofixed.Corresponding C++ API:
viren2d::StreamColorizer::GetLimitsMode/SetLimitsMode.- Type:
- class viren2d.LimitsMode
Enumeration of how the colorization limits should be computed.
Members:
- Continuous :
Compute limits for each incoming sample separately.
Corresponding string representation:
'continuous'.- Fixed :
Use fixed, user-defined limits.
Corresponding string representation:
'fixed'.- Once :
Compute limits from the first incoming sample, then apply these to all further samples.
Corresponding string representation:
'continuous'.
Relief Shading
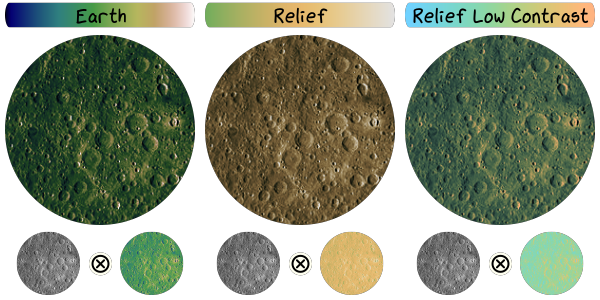
- viren2d.relief_shading(relief: viren2d.ImageBuffer, colorized: viren2d.ImageBuffer) viren2d.ImageBuffer
Multiplicative relief shading.
Combines a false color representation with the relief data via element-wise multiplication. This can enhance the shape perception significantly due to the shading.
Note that the
ColorMapshould be selected with care to avoid interfering with the perception of features induced by the shading. Particularly well suited color maps have only low (or even no) variation in lightness values, e.g.ColorMap.RelieforColorMap.ReliefLowContrast.Corresponding C++ API:
viren2d::ReliefShading.- Parameters:
relief – A single channel
ImageBufferornumpy.ndarrayholding the topographic data. If the data is an integer type, it will be divided by 255 and converted to single precision floating point before multiplication.colorized – An
ImageBufferornumpy.ndarrayof typenumpy.uint8holding the color image to be shaded.
- Returns:
An
ImageBufferof typenumpy.uint8which has the same number of channels ascolorized.
Example
>>> import viren2d
>>> moon = viren2d.load_image_uint8('examples/data/lunar-farside.jpg')
>>> vis = viren2d.colorize_scaled(
>>>     data=moon, colormap='relief-low-contrast', low=0, high=255)
>>> shaded = viren2d.relief_shading(relief=moon, colorized=vis)
Example Data
- viren2d.peaks(height: int = 600, width: int = 600) viren2d.ImageBuffer
Computes the peaks example data.
Returns exemplary data for visualization from translated and scaled Gaussian distributions, known from MATLAB: \(\operatorname{peaks}(x,y) = 3 \left(1 - x\right)^2 e^{-x^2 - (y+1)^2} - 10 \left( \frac{x}{5} - x^3 - y^5 \right) e^{-x^2 - y^2} - \frac{1}{3} e^{-(x+1)^2 - y^2}\).
Corresponding C++ API:
viren2d::Peaks.- Returns:
A
widthbyheightsingle-channelImageBufferof typenumpy.float64.
Example
>>> import viren2d
>>> data = viren2d.peaks(height=400, width=400)
>>> vis = viren2d.colorize_scaled(
>>>     data, colormap='gouldian', low=-8, high=8,
>>>     bins=256, output_channels=3)