Color Maps
Important
Note that not every color map is perceptually uniform. Always check the
documentation of the corresponding ColorMap enum value
when selecting a suitable false color schema.
Be also aware that choosing a color map is more intricate than most people anticipate. For more details, I highly recommend Peter Kovesi’s excellent article about the caveats with color maps and how to avoid them.
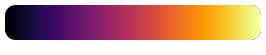
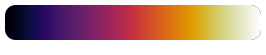
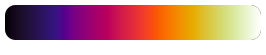
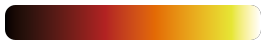
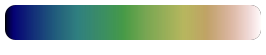
Sequential
Sequential (aka linear) color maps linearly increase/decrease the lightness and/or saturation over the color map range. They are the most generic color maps and should be used to represent data which has an intrinsic ordering.
Name |
Gradient |
|---|---|
cividis |

|
cvd-sequential |

|
cvd-sequential-vivid |

|
gouldian |

|
viridis |

|
inferno |
|
hell |
|
thermal |
|
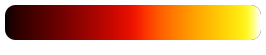
black-body |
|
hot |
|
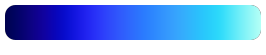
cold |
|
water |

|
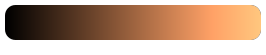
copper |
|
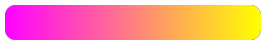
spring |
|
summer |

|
autumn |

|
winter |

|
gray |

|
yarg |

|
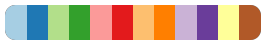
Categorical
Categorical or quantitative maps are color palettes with distinct colors, suitable to visualize categorical data.
Name |
Gradient |
|---|---|
categories-10 |

|
categories-12 |
|
categories-20 |

|
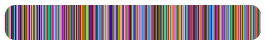
glasbey-dark |
|
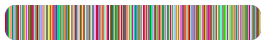
glasbey-light |
|
Cyclic
Cyclic color maps begin and end at the same color. They are useful to represent data that wraps around, e.g. phase angles or orientation values.
Name |
Gradient |
|---|---|
cvd-orientation |

|
orientation-4 |

|
orientation-6 |
|
hsv |
|
optical-flow |
|
twilight |

|
twilight-shifted |

|
Color Vision Deficiency
These color maps are suitable for viewers with color vision deficiency (CVD). The colors are chosen such that people who are color blind should share a common perceptual interpretation of data with people who have normal color vision.
Name |
Gradient |
|---|---|
cividis |
|
cvd-sequential |
|
cvd-sequential-vivid |
|
cvd-diverging |
|
cvd-orientation |
|
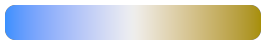
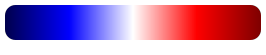
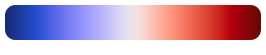
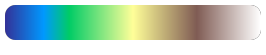
Diverging
Diverging color maps are suitable to represent values above or below a defined reference value. Note that these maps usually have a small perceptual flat spot at the center.
Name |
Gradient |
|---|---|
cvd-diverging |
|
seismic |
|
temperature |
|
temperature-dark |

|
spectral-diverging |

|
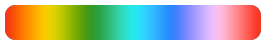
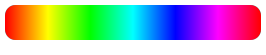
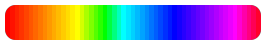
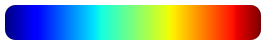
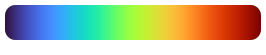
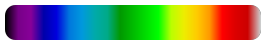
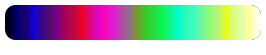
Rainbow
Rainbow color maps are widely used but also too often misused. They require special care as they can easily lead to perception of features that are not present in the data and also suffer from blind spots (where the viewer cannot distinguish actually present features).
These issues can be seen for example at the jet color gradient below, which shows banding effects. For further details, refer to the summary provided on Peter Kovesi’s website.
Name |
Gradient |
|---|---|
jet |
|
rainbow |

|
turbo |
|
Special Purpose
These color maps are often designed for a particular purpose, such as
representing thermographic (thermal), topographic (earth, ocean,
etc.), or multi-spectral (spectral) data.
Name |
Gradient |
|---|---|
ocean |

|
water |
|
earth |
|
terrain |
|
relief |

|
relief-low-contrast |

|
thermal |
|
spectral |
|
disparity |
|
optical-flow |
|
User-Defined Colors
If you need other than the provided color maps, you can define your custom
color maps via set_custom_colormap(). These can then be used
analogously to the predefined color maps via the enumeration values
ColorMap.Custom1, ColorMap.Custom2, etc. or their
string representation.
For example:
 1# Exemplary categorical data for visualization
 2import numpy as np
 3labels = np.array(
 4    [[0, 1, 2], [-3, -4, -6], [20000, 20001, 20003]],
 5    dtype=np.int32)
 6
 7# Register a custom color map. This is a usage example and by
 8# no means a useful color map!
 9viren2d.set_custom_colormap(
10   'custom1', ['#800000', (0.94, 0.13, 0.15), 'rose-red'])
11
12# Apply the custom map for label colorization:
13vis = viren2d.colorize_labels(labels=labels, colormap='custom1')